Champions League T20 (CLT20) 2014 – Statistical highlights
CLT20 2014 - Statistical highlights
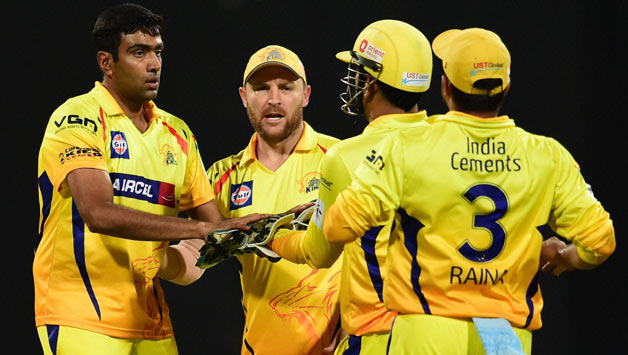
Chennai Super Kings (CSK) eventually became the champions of the Champions League T20 (CLT20) 2014 in India. Bharath Seervi presents the numbers and statistics of the tournament.
CSK, led by MS Dhoni has been the most dominating Twenty20 team since their introduction in 2008. After being Indian Premier League (IPL) Champions twice and IPL runner-ups thrice, CSK lifted their second CLT20 trophy by defeating Gautam Gambhir’s Kolkata Knight Riders (KKR) by eight wickets in the finals at Chinnaswamy.
This edition saw many good scores being chased with some fine innings by batsmen. There were 228 sixes hit throughout the tournament and 625 fours. The average run rate (including the qualifiers) in this edition was 8.03, which is the highest among all the previous five editions of the tournament.
Average run rate in the Champions League editions (including Qualifiers)
| Edition | Run Rate |
| 1 (2009) | 7.25 |
| 2 (2010) | 7.95 |
| 3 (2011) | 7.67 |
| 4 (2012) | 7.38 |
| 5 (2013) | 8.00 |
| 6 (2014) | 8.03 |
Let us see all the numbers and statistics of this edition of CLT20 in the following tables. All the figures in the tables correspond only to the main stage of the tournament and not the qualifiers.
Batting& Bowling Run Rate in different phases of innings
In the PowerPlay overs (the first six), Cape Cobras’ batsmen scored with the highest average run rate (9.33). Correspondingly, Lahore Lions (5.77) were the only team to score less than run a ball in the PowerPlay. In the last five overs, CSK scored at 12.25, the highest among all the teams and Barbados Tridents (8.56) the lowest. The team which conceded runs with the lowest run rate in PowerPlay was Perth Scorchers (6.12) and team which conceded runs with highest run rate was Kings XI Punjab (KXIP) at 8.30.
| Team | Over 1 to 6 | Over 7 to 15 | Overs 16 to 20 | Overall | ||||
| Bat | Bowl | Bat | Bowl | Bat | Bowl | Bat | Bowl | |
| Barbados Tridents | 6.91 | 7.70 | 7.66 | 6.66 | 8.56 | 10.52 | 7.64 | 7.84 |
| Cape Cobras | 9.33 | 7.70 | 6.74 | 8.86 | 9.03 | 11.58 | 8.15 | 9.10 |
| Chennai Super Kings | 8.46 | 7.56 | 8.42 | 7.24 | 12.25 | 10.43 | 9.35 | 8.07 |
| Dolphins | 8.87 | 7.08 | 7.13 | 9.88 | 9.05 | 11.60 | 8.13 | 9.47 |
| Hobart Hurricanes | 6.16 | 7.20 | 7.24 | 7.38 | 11.37 | 8.44 | 7.85 | 7.56 |
| Kings XI Punjab | 8.06 | 8.30 | 7.82 | 7.26 | 10.55 | 8.17 | 8.44 | 7.77 |
| Kolkata Knight Riders | 6.80 | 7.55 | 8.05 | 7.31 | 10.71 | 9.40 | 8.29 | 7.89 |
| Lahore Lions | 5.77 | 6.66 | 7.22 | 6.14 | 9.33 | 10.74 | 7.31 | 7.36 |
| Northern Knights | 7.66 | 7.62 | 7.11 | 7.76 | 10.60 | 12.58 | 7.92 | 8.71 |
| Perth Scorchers | 5.83 | 6.12 | 7.02 | 6.69 | 10.26 | 10.57 | 7.44 | 7.48 |
Wickets Lost and taken in different phases of innings
The table below shows the number of wickets lost and took by the teams in the various phases of innings in the tournament. Overall 262 wickets fell in the tournament — 75 in the PowerPlay (over 1 to 6), 105 in the overs between seven and 15 and the rest 82 in the last five overs of the inning (16 to 20).
| Team | Over 1 to 6 | Over 7 to 15 | Overs 16 to 20 | Overall | ||||
| Lost | Took | Lost | Took | Lost | Took | Lost | Took | |
| Barbados Tridents | 8 | 4 | 8 | 11 | 12 | 8 | 28 | 23 |
| Cape Cobras | 5 | 4 | 9 | 9 | 9 | 7 | 23 | 20 |
| Chennai Super Kings | 9 | 12 | 10 | 16 | 6 | 12 | 25 | 40 |
| Dolphins | 11 | 7 | 15 | 5 | 8 | 5 | 34 | 17 |
| Hobart Hurricanes | 6 | 9 | 12 | 8 | 5 | 10 | 23 | 27 |
| Kings XI Punjab | 9 | 8 | 16 | 17 | 4 | 14 | 29 | 39 |
| Kolkata Knight Riders | 10 | 6 | 8 | 15 | 13 | 13 | 31 | 34 |
| Lahore Lions | 7 | 7 | 6 | 10 | 5 | 5 | 18 | 22 |
| Northern Knights | 3 | 4 | 12 | 7 | 11 | 3 | 26 | 14 |
| Perth Scorchers | 7 | 14 | 9 | 7 | 9 | 5 | 25 | 26 |
| Total | 75 | 105 | 82 | 262 | ||||
Over-wise aggregates
The most productive over was the 20th over in which the runs were scored at a run rate of 11.81 whereas the first over of the inning produced runs at the lowest run rate (5.95). The 17th over saw 17 wickets felling in the tournament and the seventh over saw just six wickets to fall in the tournament.
| Over | Runs | Wickets | Run Rate |
| 1 | 256 | 13 | 5.95 |
| 2 | 311 | 12 | 7.23 |
| 3 | 317 | 12 | 7.37 |
| 4 | 373 | 11 | 8.67 |
| 5 | 330 | 15 | 7.67 |
| 6 | 324 | 12 | 7.53 |
| 7 | 294 | 6 | 6.83 |
| 8 | 294 | 11 | 6.94 |
| 9 | 326 | 9 | 7.76 |
| 10 | 309 | 9 | 7.35 |
| 11 | 280 | 14 | 6.66 |
| 12 | 320 | 9 | 7.61 |
| 13 | 338 | 14 | 8.04 |
| 14 | 350 | 16 | 8.33 |
| 15 | 345 | 17 | 8.21 |
| 16 | 349 | 15 | 8.44 |
| 17 | 412 | 20 | 9.88 |
| 18 | 437 | 16 | 10.74 |
| 19 | 408 | 17 | 11.22 |
| 20 | 327 | 14 | 11.81 |
| Overall | 6700 | 262 | 8.12 |
Distribution of Runs Scored by teams
KKR faced the most dots, scored the most singles, threes and fours whereas CSK hit most number of sixes. The table below contains the spilt up of runs scored by all the teams in the tournament.
| Team | Dots | Ones | Twos | Threes | Fours | Sixes | Runs | Balls |
| Barbados Tridents | 198 | 161 | 36 | 1 | 53 | 22 | 580 | 471 |
| Cape Cobras | 160 | 139 | 24 | 2 | 56 | 16 | 513 | 397 |
| Chennai Super Kings | 207 | 227 | 41 | 1 | 73 | 46 | 880 | 595 |
| Dolphins | 189 | 175 | 27 | 1 | 64 | 25 | 638 | 481 |
| Hobart Hurricanes | 218 | 233 | 43 | 1 | 74 | 18 | 726 | 587 |
| Kings XI Punjab | 217 | 196 | 50 | 4 | 78 | 21 | 746 | 566 |
| Kolkata Knight Riders | 255 | 288 | 38 | 6 | 83 | 34 | 918 | 704 |
| Lahore Lions | 158 | 128 | 22 | 1 | 34 | 17 | 413 | 360 |
| Northern Knights | 184 | 135 | 42 | 1 | 51 | 14 | 510 | 427 |
| Perth Scorchers | 186 | 186 | 28 | 1 | 59 | 15 | 571 | 475 |
| Total | 1972 | 1868 | 351 | 19 | 625 | 228 | 6495 | 5063 |
Distribution of runs conceded by teams
Like the table above, this table shows the split up of runs conceded by the teams in the tournament. Dolphins conceded the most number of sixes and Northern Knights the least. KKR conceded the most number of fours and Lions the least.
| Team | Dots | Ones | Twos | Threes | Fours | Sixes | Runs | Balls |
| Barbados Tridents | 188 | 163 | 42 | 1 | 59 | 14 | 570 | 467 |
| Cape Cobras | 161 | 160 | 53 | 3 | 65 | 23 | 673 | 465 |
| Chennai Super Kings | 219 | 230 | 39 | 1 | 67 | 30 | 759 | 586 |
| Dolphins | 155 | 204 | 21 | 2 | 65 | 36 | 728 | 483 |
| Hobart Hurricanes | 250 | 194 | 29 | 3 | 67 | 18 | 637 | 561 |
| Kings XI Punjab | 229 | 201 | 34 | 2 | 72 | 25 | 713 | 563 |
| Kolkata Knight Riders | 279 | 270 | 45 | 2 | 82 | 33 | 892 | 711 |
| Lahore Lions | 153 | 121 | 19 | 1 | 41 | 16 | 422 | 351 |
| Northern Knights | 141 | 147 | 39 | 0 | 60 | 12 | 537 | 399 |
| Perth Scorchers | 197 | 178 | 30 | 4 | 47 | 21 | 564 | 477 |
| Total | 1972 | 1868 | 351 | 19 | 625 | 228 | 6495 | 5063 |
Batsmen Statistics:
| Batsmen with | Batsman 1 | Batsman 2 | Batsman 3 |
| Most dots | Robin Uthappa (61) | Jordan Carter (57) | Ben Dunk (49) |
| Most ones | Shoaib Malik (61) | Aiden Blizzard (60) | Robin Uthappa (58) |
| Most twos | Jordan Carter (17) | Suresh Raina (14) | Aiden Blizzard (12) |
| Most threes | Suryakumar YadavManan Vohra Robin Uthappa (2 each) |
||
| Most fours | Robin Uthappa (28) | Manan Vohra (20) | Ben Dunk (19) |
| Most sixes | Suresh Raina (16) | Robbie Frylinck (9) | Manish Pandey (8) |
Batsmen with highest percentage of… (restriction: 30 balls faced)
| Dots | Keshav Maharaj (64.7%) | Nasir Jamshed (59.37%) | Daryl Mitchell (54.76%) |
| Ones | Faf du Plessis (52.94%) | Adam Voges (52.8%) | Khaya Zondo (51.06%) |
| Twos | Wriddhiman Saha (14.92%) | Kane Williamson (14.1%) | David Miller (13.25%) |
| Fours | Dilshan Munaweera (23.37%) | Hashim Amla (22.61%) | Dwayne Smith (20.83%) |
| Sixes | Robbie Frylinck (18.75%) | MS Dhoni (15.38%) | Suryakumar Yadav (13.95%) |
Most Runs:
| Runs | Batsman | Innings | Ave | 50s/100s | S/R | 4s/6s | HS |
| 234 | Suresh Raina | 5 | 58.50 | 1/1 | 173.33 | 14/16 | 109* |
| 210 | Robin Uthappa | 5 | 52.50 | 1/0 | 131.25 | 28/3 | 85* |
| 203 | Jordan Carter | 4 | 67.66 | 0/1 | 136.24 | 18/8 | 111* |
| 188 | Aiden Blizzard | 5 | 47.00 | 2/0 | 140.29 | 17/6 | 78* |
| 172 | Manish Pandey | 5 | 43.00 | 1/0 | 140.98 | 16/8 | 76* |
Bowler Statistics:
| Bowler with… | Bowler 1 | Bowler 2 | Bowler 3 |
| Most Dots | Ben Hilfenhaus (67) | Sunil Narine (58) | Akshar Patel (55) |
| Most Ones | Yusuf Pathan (52) | Piyush Chawla (51) | Kuldeep Yadav (49) |
| Most Twos | Vernon Philander (15) | TG Southee,Ravi Rampaul (11 each) | |
| Most Threes | Nathan Coulter-Nile,Rory Kleinveldt, Piyush Chawla (2 each) |
||
| Most Fours | Ben Hilfenhaus (19) | Trent Boult,Parvinder Awana (17 each) | |
| Most Sixes | Keshav Maharaj,Piyush Chawla (10 each) | Yasir Arafat (9) |
Bowlers with highest % of… (restriction: 30 balls bowled)
| Dots | Keshav Maharaj (64.7%) | Nasir Jamshed (59.37%) | Daryl Mitchell (54.76%) |
| Ones | Faf du Plessis (52.94%) | Adam Voges (52.8%) | Khaya Zondo (51.06%) |
| Twos | Wriddhiman Saha (14.92%) | Kane Williamson (14.1%) | David Miller (13.25%) |
| Fours | Dilshan Munaweera (23.37%) | Hashim Amla (22.61%) | Dwayne Smith (20.83%) |
| Sixes | Robbie Frylinck (18.75%) | MS Dhoni (15.38%) | Suryakumar Yadav (13.95%) |
Most Wickets:
| Wickets | Bowler | Inns | Ave | Eco | S/R | BBI |
| 12 | SP Narine | 5 | 8.83 | 5.30 | 10.0 | 4/31 |
| 10 | Ashish Nehra | 5 | 15.30 | 8.05 | 11.4 | 4/21 |
| 9 | Doug Bollinger | 5 | 16.00 | 8.07 | 11.8 | 3/22 |
| 9 | Parvinder Awana | 5 | 18.00 | 8.52 | 12.6 | 4/30 |
Bowlers with worst and best economy rate in PowerPlay (restriction: 24 balls)
| Worst Economy | Best Economy | ||
| Economy | Bowler | Economy | Bowler |
| 13.00 | Jason Holder | 4.57 | Mohammad Hafeez |
| 11.20 | Craig Alexander | 4.83 | Charl Langeveldt |
| 10.40 | Aizaz Cheema | 5.00 | Joel Paris |
| 10.00 | Ravichandran Ashwin | 5.00 | Akshar Patel |
| 9.75 | Thisara Perera | 5.33 | Sunil Narine |
Bowlers with worst and best economy rate in the last five overs (restriction: 24 balls)
| Worst Economy | Best Economy | ||
| Economy | Bowler | Economy | Bowler |
| 15.25 | Pat Cummins | 5.40 | Sunil Narine |
| 15.20 | Ashish Nehra | 7.00 | Akshar Patel |
| 14.25 | Trent Boult | 7.20 | Ben Laughlin |
| 14.00 | Vernon Philander | 7.50 | Joel Paris |
| 13.00 | Aizaz Cheema | 7.75 | Sybrand Engelbrecht |
Batsman vs Bowler Statistics:
| Runs (Balls) | 4s/6s | S/R | Batsman | Bowler |
| 40 (17) | 1/4 | 235.29 | Suresh Raina | Piyush Chawla |
| 31 (9) | 0/4 | 344.44 | MS Dhoni | Yasir Arafat |
| 29 (9) | 2/3 | 322.22 | Richard Levi | Jason Holder |
| 29 (10) | 6/0 | 290.00 | Aiden Blizzard | Trent Boult |
| 28 (8) | 0/4 | 350.00 | Robbie Frylinck | Aizaz Cheema |
| 28 (8) | 2/3 | 350.00 | Manish Pandey | Kyle Abbott |
Most expensive overs:
| Runs | Bowler | Batsmen | Sequence | Over Number |
| 27 | Yasir Arafat | MS Dhoni (21)/Ravindra Jadeja (5) | 2 1 4 1 6NB 6 6 | 19 |
| 26 | Jason Holder | Richard Levi (26) | 0 6 6 4 4 6 | 3 |
| 26 | Aizaz Cheema | Robbie Frylinck (26) | 6 2 6 6 0 6 | 18 |
| 24 | Vernon Philander | Aiden Blizzard (19)/Jonathan Wells (4) | 6 NB 6 4 2 1 4 | 18 |
| 24 | Keshav Maharaj | Ravindra Jadeja (23)/Dwayne Bravo (1) | 6 6 1 1 6 4 | 17 |
Most runs in a PowerPlay: 85 by Dolphins vs CSK
Least runs in a PowerPlay: 25 by KXIP vs CSK
Most runs in last five overs: 76 by Hurricanes vs Northern Knights
Least runs in last five overs: 29 by Dolphins vs KKR (Only if the team played complete five overs)
Note: Except the first table, rest all the tables contain numbers of main stage matches only. Qualifiers are not included.
(Bharath Seervi is a cricket statistician who is obsessed with digging numbers, facts and records related to the game. An active member of Society of Cricket Statisticians of India, he blogs at www.cricketseervistats.blogspot.com. He can be followed on Twitter at www.twitter.com/SeerviBharath and on Facebook at www.facebook.com/SeerviCricket)