
Abhishek Mukherjee
Abhishek Mukherjee is the Chief Editor at CricketCountry. He blogs at ovshake dot blogspot dot com and can be followed on Twitter @ovshake42.
Written by Abhishek Mukherjee
Published: Feb 21, 2014, 06:16 PM (IST)
Edited: Feb 21, 2014, 06:16 PM (IST)


Over the years the bowling average has been a measure of how dangerous a bowler has been. Abhishek Mukherjee questions whether the oft-forgotten strike rate is a more appropriate measure.
Whenever there is a discussion regarding the choice of the most crucial parameter to measure a bowler’s achievements, the bowling average invariably comes up. Indeed, the bowling average has gone up with time; George Lohmann’s tally of 112 Test wickets at 10.75 will, it can be said safely, not emulated under the current playing conditions.
Let us, then, try to gauge the impact of time over bowling average.
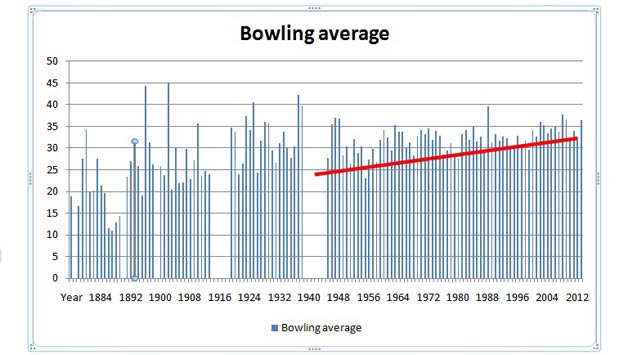
Of course, the period before World War II may provide misleading data due to the lesser number of Tests in the period. There are ways to calculate the gradient, fit a curve, and predict where things would reach in 2025, but one may assume that we have enough indication from the graph above.
Let us now go back to the formula of bowling average. It is basically a ratio of runs and wickets, which is one of the simpler definitions in the sport.
When we compare bowlers across era, we almost always take into account the fact that since bowling averages have increased over time, it will not be fair to compare bowlers across eras. For example, Curtly Ambrose’s average of 20.99 is usually considered a better number than Joel Garner’s 20.94 because of the eras they played in.
What we tend to forget, however, is the fact that the bowling average is a ratio. It has not been about the wicket-taking abilities of the bowlers: it has also been about the runs they have conceded over time.

As is evident, the batsmen have been scoring at a faster rate, and are fast approaching the 3.50 runs-an-over mark, which is definitely an indicator of the increase bowling average: given that both parameters are dependent on runs, let us remove the find their ratio — to eliminate the concept of runs altogether.
So,
Bowling average / Economy rate
= (Runs / wicket) / (6 x Runs / ball)
= (1/6) * Balls / wicket
If we remove the constant value of 1/6 we are left with balls per wicket — which is nothing but the strike rate. Has the strike rate changed over time at all?

Once the dull days of the 1960s were over, wickets kept falling as before (do note the low around the 1980-mark: guess which team was responsible for that?), and there is not much to choose between the 1940s and the 2010s in terms of bowling strike rate. This means that the bowlers have been taking wickets at least as frequently as they used to do, but they have been conceding more runs in the process.
These are the strike bowlers the captains crave for: men who pick up wickets. To win matches a captain needs 20 wickets, and without strike bowlers, however containing a line-up you have, you will never win Tests — which is why men like Chris Cairns got lost amidst a team of mediocre bowlers.
What, then, if we rank the bowlers according to their strike rates? Who are the top bowlers of the Post World War II era? Do we have the usual suspects there as well? Let us put a 200-wicket cut-off and check:
Top bowlers since World War II (cut-off: 200 wickets)
| Player | M | W | Bowling average | Economy rate | Strike rate |
| Dale Steyn | 71 | 356 | 22.9 | 3.26 | 42 |
| Waqar Younis | 87 | 373 | 23.56 | 3.25 | 43.4 |
| Malcolm Marshall | 81 | 376 | 20.94 | 2.68 | 46.7 |
| Allan Donald | 72 | 330 | 22.25 | 2.83 | 47 |
| Fred Trueman | 67 | 307 | 21.57 | 2.61 | 49.4 |
| Mitchell Johnson | 58 | 255 | 27.56 | 3.3 | 50 |
| Joel Garner | 58 | 259 | 20.97 | 2.47 | 50.8 |
| Richard Hadlee | 86 | 431 | 22.29 | 2.63 | 50.8 |
| Michael Holding | 60 | 249 | 23.68 | 2.79 | 50.9 |
| Darren Gough | 58 | 229 | 28.39 | 3.3 | 51.6 |
| Glenn McGrath | 124 | 563 | 21.64 | 2.49 | 51.9 |
| Dennis Lillee | 70 | 355 | 23.92 | 2.75 | 52 |
| Jeff Thomson | 51 | 200 | 28 | 3.18 | 52.6 |
| Brett Lee | 76 | 310 | 30.81 | 3.46 | 53.3 |
| Bob Willis | 90 | 325 | 25.2 | 2.83 | 53.4 |
| Makhaya Ntini | 101 | 390 | 28.82 | 3.23 | 53.4 |
| Chris Cairns | 62 | 218 | 29.4 | 3.28 | 53.6 |
| Imran Khan | 88 | 362 | 22.81 | 2.54 | 53.7 |
| Stuart MacGill | 44 | 208 | 29.02 | 3.22 | 54 |
(Upto end of Day One, second Test between Australia and South Africa)
Ever wondered why Mitchell Johnson is considered so lethal? Why were batsmen at least as scared of Waqar Younis as they were of Wasim Akram? Why old-timers say that they have seldom seen anyone as deadly as Imran Khan at his pomp? Or those fans at SCG who claim that SCG MacGill had a raw deal? Despite their disparity in averages, why was Jeff Thomson as dangerous an option as Dennis Lillee?
The most surprising entries are possibly those of Darren Gough and Cairns: neither have been members of formidable teams, which made their successes with the ball go relatively unnoticed. However, they have managed to pick up wickets at intervals more frequently than the giants of the sport.
It would be unfair to club the spinners with the “glamour boys”: the slow men send down more overs, tie the batsmen down, and strangle their way to success. Let us look at them separately, then:
Top spinners since World War II (cut-off: 200 wickets)
| Player | M | W | Bowling average | Economy rate | Strike rate |
| Stuart MacGill | 44 | 208 | 29.02 | 3.22 | 54 |
| Muttiah Muralitharan | 133 | 800 | 22.72 | 2.47 | 55 |
| Shane Warne | 145 | 708 | 25.41 | 2.65 | 57.4 |
| Graeme Swann | 60 | 255 | 29.96 | 2.98 | 60.1 |
| Rangana Herath | 51 | 217 | 30.01 | 2.8 | 64.2 |
| Bhagwat Chandrasekhar | 58 | 242 | 29.74 | 2.7 | 65.9 |
| Anil Kumble | 132 | 619 | 29.65 | 2.69 | 65.9 |
| Saqlain Mushtaq | 49 | 208 | 29.83 | 2.64 | 67.6 |
| Danish Kaneria | 61 | 261 | 34.79 | 3.07 | 67.8 |
| Harbhajan Singh | 101 | 413 | 32.37 | 2.83 | 68.5 |
| Abdul Qadir | 67 | 236 | 32.8 | 2.71 | 72.5 |
(Upto end of Day One, second Test between Australia and South Africa)
As mentioned before, MacGill leads the list: the two giants come next, and at five is the relatively unheralded Rangana Herath. Bishan Bedi might have had a delightful action and a mesmerising flight and loop; he might even have believed in buying a wicket at the cost of runs; but in reality he has managed to take a wicket every 80.3 balls — at a rate significantly worse than those of Bhagwat Chandrasekhar, Anil Kumble, or even Harbhajan Singh.
Do note how high Danish Kaneria is placed as well, and the comparative averages of MacGill and Lance Gibbs. If the bowlers had been bowling 50-over spells MacGill would have picked up 5.6 wickets on an average, while Gibbs would have returned a haul of 3.4 wickets.
However, the main test of a strike bowler is in victories, and Dale Steyn emerges at the top again. There is a surprise at the second position, though.
Top bowlers in victories since World War II (cut-off: 100 wickets)
| Player | M | W | Bowling average | Economy rate | Strike rate |
| Dale Steyn | 37 | 247 | 16.12 | 3.09 | 31.2 |
| Shoaib Akhtar | 20 | 104 | 17.36 | 3.11 | 33.4 |
| Richard Hadlee | 22 | 173 | 13.06 | 2.33 | 33.5 |
| Waqar Younis | 39 | 222 | 18.2 | 3.12 | 35 |
| Allan Donald | 33 | 187 | 16.79 | 2.83 | 35.5 |
| Darren Gough | 18 | 105 | 19.94 | 3.28 | 36.4 |
| Malcolm Marshall | 43 | 254 | 16.78 | 2.64 | 38.1 |
| Andy Caddick | 21 | 114 | 19.67 | 3.08 | 38.2 |
| Imran Khan | 26 | 155 | 14.5 | 2.27 | 38.3 |
| Dennis Lillee | 31 | 203 | 18.27 | 2.8 | 39 |
| Michael Holding | 31 | 152 | 18.36 | 2.74 | 40.1 |
| Fred Trueman | 34 | 177 | 17.3 | 2.54 | 40.8 |
| Mitchell Johnson | 31 | 161 | 21.13 | 3.04 | 41.6 |
| Andy Roberts | 21 | 110 | 19.26 | 2.73 | 42.2 |
| Wasim Akram | 41 | 211 | 18.48 | 2.61 | 42.3 |
| Muttiah Muralitharan | 54 | 438 | 16.18 | 2.27 | 42.7 |
| Makhaya Ntini | 50 | 233 | 22.21 | 3.11 | 42.7 |
| Ian Botham | 33 | 172 | 20.09 | 2.77 | 43.4 |
(Upto end of Day One, second Test between Australia and South Africa)
Shoaib Akhtar was not one of the greatest bowlers in history, but when in full flow there have been few spectacles in world cricket to match him steam in to bowl. His raw pace has also delivered wins for Pakistan.
Surprisingly, though Cairns is absent here, both Gough and Andy Caddick have made it to the top ten: with a wicket every six overs in victories, one can only imagine what they could have done had they received proper support.
Let us do the obligatory table for spinners as well:
Top spinners in victories since World War II (cut-off: 100 wickets)
| Player | M | W | Bowling average | Economy rate | Strike rate |
| Muttiah Muralitharan | 54 | 438 | 16.18 | 2.27 | 42.7 |
| Anil Kumble | 43 | 288 | 18.75 | 2.52 | 44.4 |
| Stuart MacGill | 31 | 165 | 24.4 | 3.14 | 46.5 |
| Graeme Swann | 30 | 150 | 22.66 | 2.84 | 47.8 |
| Jim Laker | 19 | 101 | 13.65 | 1.7 | 48 |
| Danish Kaneria | 23 | 120 | 21.91 | 2.68 | 49 |
| Shane Warne | 92 | 510 | 22.47 | 2.63 | 51.2 |
| Derek Underwood | 27 | 123 | 15.18 | 1.75 | 51.9 |
| Harbhajan Singh | 42 | 221 | 22.76 | 2.56 | 53.3 |
| Abdul Qadir | 21 | 100 | 23.49 | 2.6 | 54.2 |
| Richie Benaud | 24 | 128 | 18.32 | 1.9 | 57.7 |
| Daniel Vettori | 33 | 127 | 21.92 | 2.2 | 59.6 |
| Lance Gibbs | 30 | 154 | 19.16 | 1.9 | 60.4 |
Where is Warne? He’s down there, seventh on the list, below MacGill, Graeme Swann, and Kaneria — while Gibbs, somewhat predictably, languishes at the bottom. In fact, Gibbs’ strike rate in wins is worse than MacGill’s career strike rate.
Which country is the favourite hunting ground for bowlers, then?
Once again, the average does not provide the true story. The following graph will demonstrate that the average varies little depending on the host country:

All the numbers, as evident, are between 30 and 35; this means that there is little to choose. The strike rate, however, gives us the real picture:

Now we’re talking: a lot of runs are scored in Bangladesh, but wickets fall very fast. India is, as expected, the most difficult place for bowlers, but thanks to Murali and Herath, wicket-taking has not been as difficult in Sri Lanka.
So, from the next time, while you should not ignore the bowling average, the usually overlooked strike rate is a feature almost as handy. Remember, a strike rate below 60 is at least as impressive as an average below 30.
(Abhishek Mukherjee is the Deputy Editor and Cricket Historian at CricketCountry. He blogs at http://ovshake.blogspot.in and can be followed on Twitter at http://www.twitter.com/ovshake42)